Ukraine as a sovereign state has gone a long way in the process of complicated economic transformations. In the course of this time it managed to solve the key issue of the above mentioned transformation: the formation of such basic components of national economy, as the structure of finances, tax, banking, customs etc. determining the economic infrastructure of our state system. The essential principles of market infrastructure had been approved. The stock market, the goods market and the market of financial services came into being; the foundations of the two-level banking system, the currency market and the primary market were laid; the national payment system was created, new money remittance technologies using epayments were introduced which helped to meet the world information standards of inter-bank settlements.
At the onset of reforms the macroeconomic stabilization and money reform were the main priorities. Their implementation became possible in September 1996 only, when inflation was curbed, price subsidy reduced, and budget deficit stabilized. Henceforth economic reforms were aimed at macroeconomic stabilization, real GDP growth, inflation rate cut, and the stabilization of the national monetary unit (Table 1).
Table 1. Ukraine. Macroeconomic Indicators: Dynamics for 2000–2005 (%)
| Indexes | 2000 |
2001 |
2002 |
2003 |
2004 |
2005 |
Real GDP |
5,9 |
9,2 |
5,2 |
9,6 |
12,1 |
2,6 |
Industrial output |
13,2 |
14,2 |
7,0 |
15,8 |
12,5 |
3,1 |
Agricultural produce |
9,8 |
10,2 |
1,2 |
-11,0 |
19,7 |
-0,1 |
Fixed capital investments |
14,4 |
20,8 |
8,8 |
31,3 |
28,0 |
101,9 |
Active declared income of population |
4,1 |
10,0 |
18,0 |
9,1 |
19,6 |
18,9 |
Export of goods and services (balance of trade) |
18,8 |
9,7 |
11,1 |
24,1 |
39,0 |
6,3 |
Balance of the overall budget (% to GDP) |
0,6 |
-0,3 |
0,7 |
-0,2 |
-3,2 |
-1,8 |
National debt (% to GDP) |
45,2 |
36,6 |
33,6 |
29,7 |
24,7 |
18,4 |
Inflation rate (December vs. December of the previous year) |
25,8 |
6,1 |
-0,6 |
8,2 |
12,3 |
10,3 |
Unemployment rate |
11,6 |
10,9 |
9,6 |
9,1 |
8,6 |
7,2 |
In geopolitical context Ukraine experiences the impact of the leading world economies. The manifestations of globalization in Ukraine include the improvement of information technologies, emergence and development of Ukrainian corporations, the expansion of the tertiary sector of economy, the advance in technology exchange etc. Negative consequences of globalization include labor force flow-out, the introduction of raw material intensive industries endangering natural environment, higher financial risks etc.
The transition to new economic relations in Ukraine was accompanied by the search for the balanced resort to market and state regulators of economy.
Privatization is the main driver of transformation. It brought about multistructural economy in Ukraine. The methods applied included both auctioning of the objects of privatization and noncompetitive buy-outs (mainly by leaseholders).
The emerging Ukrainian market should be socially oriented on the basis of the long-term innovative strategy intended to improve the standards of living.
Hence the priorities of state development include the evolvement of competitive economy, forming of effective budgetary, tax, finance-and-credit systems, and making of innovative economy.
Therefore the most important are rational use of domestic natural and labor resources, intensive development of tertiary and quaternary sectors of economy, increase of national financial capital, enhancement of intellectual and information potentials, ecofriendly production harmonizing interests of the state, population, and entrepreneurs.
In order to create its own information society Ukraine should implement effective economic strategy, relying upon its natural, labor, intellectual, and production potentials. Geographical differentiation of many economic and social processes is typical for Ukraine. For example, five regions (Kyiv City, Donets’k, Dnipropetrovs’k, Kharkiv, and Odesa Oblast’s) account for 49% of GDP, 59% of direct foreign investments, 65% of export, 45% of import (2004), and the highest indices of innovation development and infrastructure networks. The gap in socio-economic development levels of the regions is strikingly big.
Accordingly each region needs its own strategy of socio-economic development, which would take into account the resources and capacities of a region and would be oriented at national objectives.
Finances and credit. The first financial institutions emerged in Ukraine in the 18th c.; however, national financial system began evolving only in the 1990s. with the formation of independent Ukrainian state and market economy.
Moneyed corporations make an important constituent of this system. By the end of 2004 there were 182 banks and 160 of them were operating. Due to domestic banking there has been recent considerable increase of financial capital, bank assets, deposit balances of population etc. Functioning credit banks were concentrated in twenty cities in 2004. Over 50% of banks, authorized funds, capital and assets have been accumulated in Kyiv, which became the hub controlling 80% of domestic bank branches. High concentration of banks can also be observed in Kharkiv, Dnipropetrovs’k, Odesa, Donets’k, Zaporizhzhia, and L’viv.
Development of the regional network of commercial banks proceeds in two directions: 1) opening of branches and regional offices as territorial parts of greater, so-called system banks organized on the basis of state banks; 2) territorial extensions of the active network of major commercial banks.
The main attribute of the booming investment market is the National Depositary System. In the early 2004 there were 364 registrars and 122 depositaries of securities the majority of whom (60.8%) operated in Kyiv, Kharkiv, Donets’k, and Dnipropetrovs’k Oblast’s.
The infrastructure of stock market includes traders in securities, trade organizers, depositaries, joint investment institutions etc. In 2003 there were 857 traders in securities; 15.5% of them were commercial banks, 13.2% represented investment companies, 71.3% were specialized traders on the secondary stock market. 46.4% of these traders operated in Kyiv Oblast’, 9.1% in Kharkiv, 9.2% in Dnipropetrovs’k, and 7.8% in Donets’k Oblast’.
In 2003 the insurance market was represented by 335 insurance organizations. In the period of 2000–2003 the income of insurance organizations in Ukraine went up by a factor of 7.5 and made over UAH 15.1 bln. 240 insurance organizations (or 71.6%) concentrated 47.5% of their income (UAH 7 142.4 mln) in Kyiv, Kharkiv, Donets’k, Dnipropetrovs’k, and Odesa.
Industry. According to the UN data, Ukraine occupied the 42nd place in the world by the human development index in 1992 and was considered a developed economy; machine building (about 50% of GDP) was the leader of the diversified domestic industry with its extensive network of industrial centers. Despite the production slump in the 90s, this industry is still the top producer in Ukraine (see fig. 1).
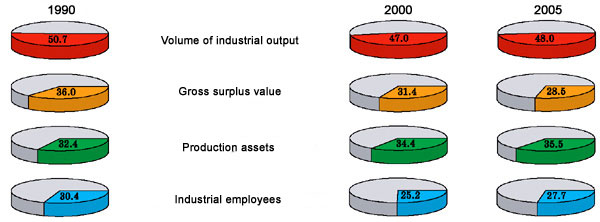
Fig. 1. Part of industry in the economy (%)
After 2000 the structure of industry data are based on the Standard Industrial Classification of all economic activity (CICEA). The data on industry are a sum of economic activity types, which, contingent upon the CICEA, include extractive and manufacturing industry, production and allocation of electric power, gas and water (sections S, D, E).
By the volume of industrial product, work and services sales (Fig. 2) Donets’k (21.0%), Dnipropetrovs’k (14.7%), Zaporizhzhia (7.3%), Luhans’k (7.4%), Poltava (4.9%) Oblast’s and Kyiv (12.1%) were the national leaders in 2005.
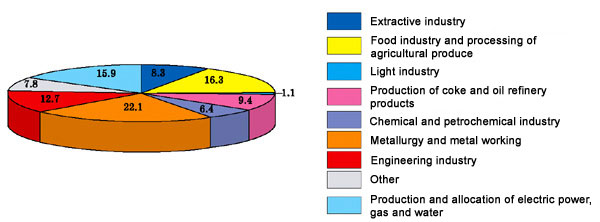
Fig. 2. The structure of commercialized industrial output volume by types of activity (2005, %)
After 1990 the industrial structure is undergoing significant structural shifts related to the redistribution of branch input into total output on the basis of value terms. The part of machine building industry dwindled (from 30.5% (The structure of produced products volume) in 1990 to 12.7% (The structure of marketed products volume) in 2005 in the cost pattern of industrial output). Formerly this branch manufactured armaments, equipment for mining, metallurgical, power, chemical industry, agricultural machines, sea vessels, airplanes and domestic electronics for internal market primarily; the disintegration of the Soviet Union was a time of stress for this industry.
Now the part of raw and power-consuming industries went up. In 2005 such basic industries as power engineering, fuel industry and metallurgy were responsible for 47.7% of industrial output, while engineering, light and food industry only 30.1%. The part of heavy industry more than doubled from 1991 to 2005.
The following factors and processes are topical today: the improving labor productivity has exceeded the pre-crisis level of 1990; the rising investment demand has allowed renewing key assets; such major investment branch as mechanical engineering has been gathering strength recently. This process helps to improve technical and technological level of production.
Powerful fuel and energy complex (FEC) plays an important role in economic and social development of Ukraine. Coal mining is the leading sector of this branch, producing 78.4 mln tons (2005), which corresponds to current domestic demand. Reforms in the branch include the formation of public holdings, privatization of coal mining and processing enterprises, closure of noncommercial and spent mines. The coal-preparation plants, which used to apply the most advanced technologies in the 70s, are undergoing reconstruction now.
The oil-and-gas industry is only partially supplied with domestic raw materials: 6–7% of oil, and up to 20% of gas. The major part of import of hydrocarbon raw materials comes from Russia. Most refineries (LiNOS etc.) are privatized; their total annual output comprises 60 mln tons, but their utilized capacity is below one third.
The prospects of oil-refining industry of Ukraine lie in the improvement of the domestic raw materials base and the introduction of modern technologies. Today the development of oil and gas deposits on the shelves of the Black and Azov Seas, in the Crimea and the Dnipro–Donets’k Depression in the east is under way.
Gas industry of Ukraine is characterized by high percentage of gas import, great gas pipelines length (over 35,000 km) and numerous underground gas-holders (13). Ukrainian pipelines transport 250 bln m3 of gas annually, including 120 bln m3 of Russian transit to Europe.
The second important constituent of FEC of Ukraine is power industry. There are over 11 100 of power stations producing 52 900 MW; thermoelectric power stations provide for 66.5% of total output, NPP – for 24.4%, and hydroelectric power stations – for 9.0% of total output. The total length of power lines makes about 1 mln km; power output comprised 186 bln kWh in 2005. The main developmental problems are the introduction of energy and resource saving technologies, new equipment, increase of labor productivity, and the improvement of ecological infrastructure. Energy saving is a national problem now.
The heat-and-power engineering holds lead; its enterprises are concentrated in old industrial regions and centers: Donbas, Prydniprovya (the Dnipro River Basin), Peredkarpattia (Forecarpathians), Kyiv, Kharkiv, L’viv etc. Several regional power plants – the Burshtyn and Starobeshiv SRPPs, thermoelectric power plants – the Kryvyi Rih, Zmiiv, Luhans’k, and Prydniprovs’ka TPPs need reconstruction.
A special place is occupied by nuclear power industry, which supplies 47.7% of electric power (APPs Rivne, Khmelnyts’kyi, Zaporizhzhia and Pivdennoukraiins’ka). The Vatutine, Michuryne, Tsentral’ne, Novokostiantynivka uranium deposits are being developed now. Such a potential of natural resources suggests the creation of nuclear-fuel cycle.
Metallurgy occupies the most important place in Ukrainian industrial complex and is one of the branches Ukraine specializes in. It is based on quality domestic sources of raw materials: coal, iron, manganese, titanic, and zirconium ores as well as nonferrous (nickel, mercury) and precious metals (gold).
Metallurgical complex has a complex branched structure. It consists of base industries related to extraction and ore-dressing of ferrous and nonferrous metals (mining and ore-dressing plants, by-product-coking industry) and foundry (cast-iron, open-hearth steel, oxygen-converter, electro-ferrous alloys etc.), rolled steel production, casting, forged pieces, metalwork, etc. Due to its highly developed metallurgy Ukraine entered the world markets. The export of ferrous, nonferrous metals and metalwork is the source of major budget receipts.
The key problems of metallurgy development are as follows: technological retooling of industry, development of concomitant industries (building, chemical) on the basis of industrial waste utilization, the adoption of environment-conscious approach.
Agriculture. Ukraine has favorable natural conditions for farming which is the old and traditional type of activity for Ukrainian population.
The technically backward and underpaid farming is slow to keep the pace of reforms in Ukraine. The lack of land reforms, poor material and technical basis, prices disparity between industrial and agricultural products, and rural social underdevelopment are hampering further progress. It is the main cause of the key assets deterioration and worsening of material and technical supply of agriculture, as well as production slump (Fig. 3, 4).
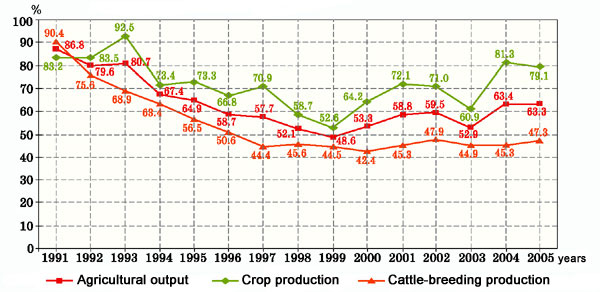
Fig. 3. Indices of farming output (% to 1990)
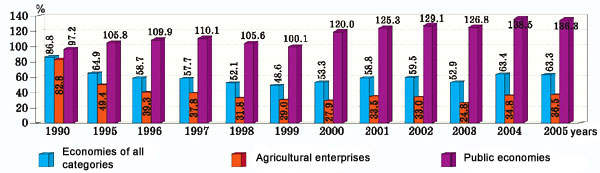
Fig. 4. Categorized indices of agricultural output (% to 1990)
Table 2. Agricultural Products: Structural Dynamics, 1990–2005 (in comparable prices in 2000, %)
| 1990 | 1995 | 1996 | 1997 | 1998 | 1999 | 2000 | 2001 | 2002 | 2003 | 2004 | 2005 | |
Agricultural products |
100 | 100 | 100 | 100 | 100 | 100 | 100 | 100 | 100 | 100 | 100 | 100 |
Plant growing |
50,2 | 56,7 | 57,0 | 61,6 | 56,5 | 54,4 | 60,4 | 61,6 | 59,9 | 57,7 | 64,4 | 62,7 |
Grain |
21,2 | 20,9 | 17,4 | 25,3 | 21,1 | 20,6 | 19,5 | 28,3 | 27,3 | 16,4 | 27,7 | 25,3 |
Industrial crops |
7,3 | 7,7 | 6,8 | 5,8 | 5,8 | 6,5 | 6,7 | 5,5 | 6,0 | 7,5 | 6,2 | 7,5 |
Potatoes, vegetables, melons and gourds |
10,5 | 16,6 | 21,1 | 19,5 | 21,3 | 20,0 | 25,5 | 21,3 | 20,4 | 25,4 | 23,4 | 22,9 |
Fruits and grapes |
3,8 | 3,7 | 4,6 | 5,4 | 3,0 | 2,5 | 4,2 | 3,0 | 3,1 | 4,7 | 3,9 | 4,1 |
Fodder crops |
6,6 | 5,9 | 5,2 | 5,5 | 4,7 | 4,0 | 3,6 | 3,3 | 2,9 | 3,1 | 2,6 | 2,5 |
Other products and dynamics of unfinished production |
0,8 | 1,9 | 1,9 | 0,1 | 0,6 | 0,8 | 0,9 | 0,2 | 0,2 | 0,6 | 0,6 | 0,4 |
Products of cattle-breeding |
49,8 | 43,3 | 43,0 | 38,4 | 43,5 | 45,6 | 39,6 | 38,4 | 40,1 | 42,3 | 35,6 | 37,3 |
Cattle and poultry |
29,0 | 21,3 | 20,8 | 18,2 | 21,3 | 22,2 | 19,2 | 19,2 | 19,3 | 19,4 | 16,2 | 17,2 |
Milk |
15,4 | 16,9 | 17,0 | 15,1 | 16,7 | 17,4 | 15,0 | 15,0 | 15,0 | 16,4 | 13,7 | 13,7 |
Eggs |
3,7 | 3,3 | 3,4 | 3,3 | 3,7 | 4,1 | 3,8 | 3,8 | 4,4 | 5,0 | 4,3 | 4,7 |
Other products |
1,7 | 1,8 | 1,8 | 1,8 | 1,8 | 1,9 | 1,6 | 1,6 | 1,4 | 1,5 | 1,4 | 1,7 |
Economic transformations created multiform farming. The number of farms increased from 14 700 (end of 1992) to 42 400 (end of 2005) and the average farmstead area – from 19.9 to 86.3 ha. The distribution of increased specialized public farmsteads was as follows in 2005: grain – 24.3%, sugar beets – 21.5%, sunflower seeds – 21.2%, potato – 98.8%, vegetables – 89.1%, meat – 63.2%, milk – 81,2%, eggs – 50.5%, wool – 78.3%.
During this period the weight of plant cultivation went up considerably. In the course of the last fifteen years the restructuring of areas under main crops took place. The part of corn and pulse plants grew from 45 to 57.6%, potatoes, vegetables, melons and gourds – from 6.4 to 7.8%, industrial crops – from 11.6 to 20.2%; the part of forage crops shrank from 37.0 to 14.4%.
Grain-crops, sugar beets and sunflower make the basis of Ukrainian agrarian economy: they meet the internal demand and make the core of agroindustrial export.
Traditionally the production of grain in Ukraine belongs to strategically important industries, vital for the development of not only agriculture but also of the economic complex (Fig. 5). For a long time now the grain crops have been occupying over a half of arable land; the croppage and per capita production of grain have always permitted to list Ukraine among the 6-7 top world producers.
Grain production dropped considerably in 1990s; however in 2001 this key branch of plant growing revived and fetched 39.7 m tons of total yield. This created a possibility to meet the internal demand and even to export grain.
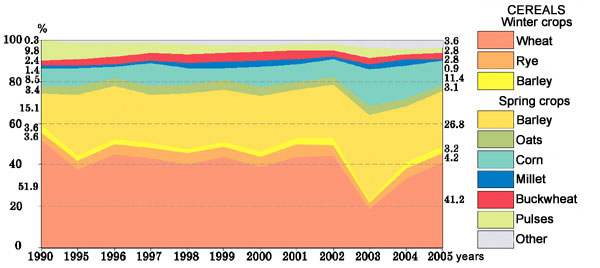
Fig. 5. Structural dynamics of areas under cereals in Ukraine (1990–2005, %)
In 1990–2005 the total sown area of industrial crops climbed up (from 3.8 to 5.3 mln ha) substantially; sugar beets and sunflower became the priority cultures (Fig. 6).
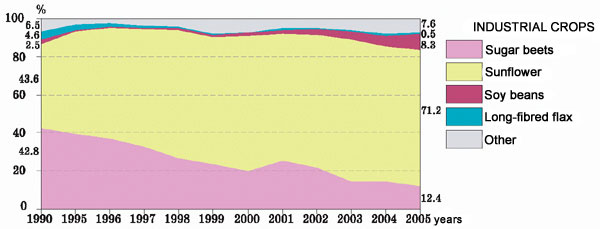
Fig. 6. Structural dynamics of areas under industrial crop sown in Ukraine (1990–2005, %)
Sugar beets growing. Ukraine has an old tradition of sugar making. Due to favorable soil and climatic conditions and efficient technologies Ukraine always occupied the leading position among European sugar exporters, including five countries producing cane sugar.
Weathering the crisis of 1990s and the revival of sugar production, leveling it up with other competitors of the world market became the national target. The important condition of reaching it is the efficient rise of sugar beets growing, sugar-refineries reconstruction and retooling and the adoption of new laws aimed at the regulation of the entire complex of sugar-beet production and processing.
Sunflower is another important export culture. Its part in the structure of areas under industrial crops grew from 43.6% (1990) to 71.2% (2005) (i.e. 1.6 times); the croppage grew from 2.6 to 4.7 mln tons. The yield increase remains a topical issue, the tackling of which demands the implementation of proper modern technologies.
From 1990 till 2005 the production of vegetables in all categories of farmsteads grew from 6 666 to 7 295 ths tons; the area under vegetables added 9 ths ha. Private plots supply a considerable part of total vegetable production.
Animal husbandry. Animal husbandry made 37.3% of total agricultural products in 2005 (table. 2). In Ukraine all its main branches – cattle breeding, pig breeding, poultry farming, sheep breeding, beekeeping, horse breeding and fishing– are developing; there are also large meat and dairy complexes. Until recently the products of animal husbandry were exported.

Fig. 7. Livestock total in all categories of farmsteads (end of the year, mln of livestock)
Meat production. In 2005 all kinds of farmsteads produced 1,597 ths tons of meat (slaughter weight); beef made 35.2%, pork 30.9%, poultry 31.1%, mutton 1.0%, rabbit 0.8%, horseflesh 1.0%. During the last two years the production and consumption of meat was on the uptrend; in 2005 it made 39.1 kg per person. Today the country has every potential to resume export.
Dairy products. The appropriate steps are made in the development of dairy farming in Ukraine in order to stabilize the livestock of milk cows, prevent its reduction and increase its productivity. This process will demand the restructuring of forage base, the improvement of cattle’s food allowance and the quality of forages.
Investments and construction. The transition of Ukraine to market economy is accompanied by considerable changes of intensity and structure of investment activity. The latter strongly depends on the general economic situation in the country; therefore the investment activity plunged in 1991–1997; from 1998 the fixed capital investments (FCI) started upping and reached UAH 93.1 bln in real prices in 2005; however, it constitutes 56.8% of 1990 index.
Changes in the branch structure of investments are under way: the part of farming dropped from 21.3% in 1990 to 5.3% in 2005 while that of industry rose from 34.5% to 37.6%) and the part of transport and communication rose from 9.6% to 18.1%.
The biggest lump was allotted to developed industrial regions of Donets’k (66.2%), Zaporizhzhia (57.0%), Luhans’k (75.6%), and Poltava (63.7%) Oblast’s, the least sum went to Zakarpattia (26.5%) and Ternopil’ (19.2%) Oblast’s – the regions with prevailing agrarian sector, the AR of Crimea (21.3%), Odesa (15.9%) and Vinnytsia Oblast’s (24.5%). There is no regional differentiation concerning investments into social and cultural projects.
The reduction of industrial construction, which usually needs heavy funding of installation work and major repairs, modified the technological structure of investments. In particular, the part of construction and assembling works increased and constituted 40.0 – 43.3% in 2005.
Sources of investments have changed radically: the part of centralized state FCI fell down from 27.0% in 1990 to 5.5% in 2005; this index is about the same in most regions of Ukraine. The part of investments adopted at the expense of enterprises’ owned assets decreased from 68.6% in 2000 to 57.4 in 2005 of the total adopted assets. The part of foreign investments is declining (in 2000 – 5.9%, in 2005 – 5.0%).
Territorial differentiation is an important characteristic of investment activity in Ukraine: i.e. the redistribution of fixed capital investments among industrial (Donbas, industrial Dnipro Basin etc.), mainly agrarian (Podillia, Central Ukraine, Prykarpattia [Forecarpathians]) and industrial agrarian regions (in particular, the Black Sea littoral area).
Construction industry is radically restructured under present socio-economic conditions. The main drives are market economy, privatization of public property, and lower financial participation of traditional customers.
The dynamics of gross indexes for construction industry are conditioned by changes in the pattern of project owners. The volume of building activity in regard to public projects shrank from 71.7% to 39.6%, the part of private construction projects grew from 4.6% to 11.9% and the part of collective projects – from 23.7% to 46.8%.
Certain growth of the industrial modernization and reequipment projects’ part in the total volume of building activity is a positive trend of construction and assembling structure development.
Transport. Geopolitical and geographical positions of Ukraine are very advantageous for the development of transport, although these advantages are inadequately used. The efficacy of state transport system and its integration into European and world transport networks help to tackle major problems of the growing national economy, and allows Ukraine to join international economic system, and increase the volumes of transnational transportations. Transnational transport corridors go though Ukraine both in latitudinal and meridional directions connecting the countries of Europe and Asia, Baltic States and the Black Sea coastal regions.
Ukrainian transport system is traditionally used by the CIS countries and Russia in their deals with Mediterranean countries. Recently Ukraine has rendered important transit services carrying oil and gas to the countries of Europe.
The enterprises of transport-and-road complex produce 6.9% of GDP; their production assets make 13.4% of the country’s total.
The transport network of Ukraine includes 43 900 km of trunk pipelines, 22 ths km of railroads, 165 ths km of surfaced roads, and 2 200 km of waterways with the outlets to the Azov Sea and the Black Sea.
Tables 3 and 4 show the volumes and structure of passenger traffic and cargo transportation.
Table 3. Passenger traffic and cargo transportation by the types of public transport.
Types of transport |
Passenger traffic |
Cargo transportation |
||||||||||
1990 |
2004 |
2005 |
1990 |
2004 |
2005 |
|||||||
mln pas. |
% |
mln pas. |
% |
mln pas. |
% |
mln tons |
% |
mln tons |
% |
mln tons |
% |
|
Transport |
14 977 |
100 |
7 997 |
100 |
8 200 |
100 |
6 286 |
100 |
1 731 |
100 |
1 805 |
100 |
land |
14 917 |
99,6 |
7 982 |
99,9 |
8 183 |
99,8 |
6 167 |
98 |
1 710 |
99 |
1 784 |
99 |
railroad |
669 |
4,5 |
452 |
5,7 |
445 |
5,4 |
974 |
15 |
462 |
27 |
450 |
25 |
motor |
8 331 |
55,6 |
3 720 |
46,6 |
3 837 |
46,8 |
4 897 |
78 |
1 027 |
59 |
1 121 |
62 |
tram |
2 007 |
13,4 |
1 112 |
13,9 |
1 111 |
13,6 |
||||||
trolleybus |
3 232 |
21,6 |
1 849 |
23,1 |
1 903 |
23,2 |
||||||
metro |
678 |
4,5 |
848 |
10,6 |
887 |
10,8 |
||||||
pipeline |
296 |
5 |
221 |
13 |
213 |
12 |
||||||
water |
45 |
0,3 |
12 |
0,1 |
13 |
0,2 |
119 |
2 |
21 |
1 |
21 |
1 |
sea |
26 |
0,2 |
10 |
0,1 |
11 |
0,1 |
53 |
1 |
9 |
0 |
8 |
0 |
river |
19 |
0,1 |
2 |
0 |
2 |
0,0 |
66 |
1 |
12 |
1 |
13 |
1 |
air |
15 |
0,1 |
3 |
0 |
4 |
0,0 |
0,2 |
0 |
0,1 |
0 |
0,1 |
0 |
Table 4. Turnover of passengers and goods by types of transport.
Types of transport |
Passenger turnover |
Turnover of goods |
||||||||||
1990 |
2004 |
2005 |
1990 |
2004 |
2005 |
|||||||
bln pas.-km |
% |
bln pas.-km |
% |
bln pas.-km |
% |
bln ton-km |
% |
bln ton-km |
% |
bln ton-km |
% |
|
Transport |
222,5 |
100 |
128,6 |
100 |
135,8 |
100 |
1 039,3 |
100 |
480,1 |
100 |
473,6 |
100 |
ground |
204,7 |
92 |
123,0 |
96 |
129,6 |
96 |
761,7 |
74 |
464,9 |
97 |
457,4 |
97 |
railroad |
76,0 |
34 |
51,7 |
40 |
52,7 |
39 |
474,0 |
46 |
234,0 |
49 |
224,0 |
47 |
motor |
90,3 |
41 |
47,5 |
37 |
52,5 |
39 |
79,7 |
8 |
28,8 |
6 |
35,3 |
7 |
tram |
13,0 |
6 |
6,6 |
5 |
6,5 |
5 |
||||||
trolleybus |
21,0 |
9 |
10,8 |
9 |
11,2 |
8 |
||||||
metro |
4,4 |
2 |
6,4 |
5 |
6,7 |
5 |
||||||
pipeline |
208,0 |
20 |
202,1 |
42 |
198,1 |
42 |
||||||
water |
1,7 |
1 |
0,1 |
0 |
0,1 |
0 |
277,5 |
26 |
14,9 |
3 |
15,9 |
3 |
sea |
1,1 |
1 |
0,1 |
0 |
0,1 |
0 |
265,6 |
25 |
9,3 |
2 |
9,6 |
2 |
river |
0,6 |
0 |
0,0 |
0 |
0,0 |
0 |
11,9 |
1 |
5,6 |
1 |
6,3 |
1 |
air |
16,1 |
7 |
5,5 |
4 |
6,1 |
4 |
0,1 |
0 |
0,3 |
0,1 |
0,3 |
0,1 |
Motor transport is the top transporter (62%), railroad (25%), pipeline (12%), and river transport (1%) follow it.
Motor transport is the main carrier of goods and passengers (46.8%). Due to flat relief it is developing relatively evenly across Ukraine; the road net is denser in the western part. The density of all-purpose hard surface roads makes 273 km per 1 ths km2. The transportation of passengers takes place mainly inside Ukraine. In cargo transportations specialized motor transport (container, refrigerator) is gaining more weight. The main highways are: Kyiv–L’viv, Kyiv–Debal’tseve, Kyiv–Odesa, L’viv–Mukacheve, Kharkiv–Simferopol’, etc.; Kyiv, L’viv, Kharkiv, Khmel’nytsky, etc. are the main communications hubs.
Railroad transport is important for inside and outside transportation; it is the second biggest carrier in Ukraine: 25% of goods and 5.4% of passengers.
The railroad density makes 36 km per 1 ths km2; the density is the highest in the southeast (Donbas) and west of the country. The main trunk railroads are: Kyiv-L’viv, Kyiv-Debal’tseve, Fastiv-Donets’k, Kharkiv-Simferopol’-Sevastopol’, L’viv-Chop etc.; the biggest railroad junctions are Kyiv, L’viv, Kharkiv, Dnipropetrovs’k, Zhmerynka etc. The main cargos are coal, ore, ferrous metals, oil and oil products, mineral building materials; they make 69.7% of all transportations. The stream of supply livestock units to marine ports, to Odesa in the first place.
Pipelines are in great demand inside and outside the country; they carry oil, gas, and products of their processing; they occupy the third place among cargo carriers: 12.0%. Gas makes 77.0% of that volume and oil and oil products 22.1%.
Sea transport is gaining more importance now. In 2005 the sea ports of Ukraine handled 139.0 mln tons of cargo: 51% – export, 10%–import, 36%–transit, 3%–domestic.
The role of river transport in the structure of carrying passengers is insignificant; it manages only domestic transportation. Dry-cargo ships carry coal and coke (10.6%), mineral building materials (including cement) (47.4%), metal (6.2%), ore (24.0%). River ports handled 13.2 mln of cargo, including 15.8% of export goods.
Transport accounted for 76.1% of national volume of export services in 2004. The export of services made $4.0 bln (including pipelines – 46.7%, sea – 16.2%, railroad – 17.7%, air – 11.3%, other – 8.1%). A particle of transport services in the general volume of import of services after 2004 was 22.2%.
First of all the transport system of Ukraine needs better material resources, including new technologies of cargo operations, development of infrastructure etc.
Communication. Private telecom operators dominate in this branch; they manage 88.7% of total services. Public sector still has a strong lead in postal service (98.0%) and national telecom inspection (100%). In Ukraine, in 2005, all telecom operators provided UAH 27.4 bln worth of services, including UAH 11.0 bln to population. In the structure of summary receipts for rendering of telecommunication services trunk communications constitute 24.2% and mobile communications – 52.8%.
Primary communication network. Today Ukraine disposes of a developed long-haul communication network.
The development of fiber optic communication network in Ukraine is related to the country’s participation in major international projects such as submarine telecommunications cable system ITUR (Italy, Turkey, Ukraine, Russia), TEL (TransEuropean Fiber Optic Telecommunications Line–TransEuropean Lines) and TAE (Fiber Optical Cable System Trans Asia Europe). The TEL combined the Central and West European networks into a single European network; the TAE connects the countries of Asia and Europe by modern telecommunications facilities. It follows the ancient Silk Route, starting from Shanghai, China in the east to Frankfurt, Germany in the west. According to the last project Ukraine and several countries of the Black Sea region are responsible for the sea segment of TAE: BSFOCS or Black Sea Fiber Optic Cable System, which will permit not only to replicate the main TAE route, but also to include the countries of the Caucasian region.
The entire territory of Ukraine is covered with fiber optic and digital communication facilities. In 2003 all Oblast’ centers of Ukraine joined the network.
Late in 2003 and early 2004 simultaneously with the completion of the main line of the fiber-optic transmission system the process of bulk loops creation started. Practically all the Ukrainian fiber optic lines will be loopbacked.
Satellite communication is very important for the country integrating into global informative space, as surface communication networks cannot provide full access to global information infrastructure.
Ukraine is included to the signal coverage of 65 zonal geostationary orbit satellites. Ukrainian operators exploit 28 of them. All of the satellites cover far larger territories than Ukraine. Satellites transmit TV and radio signals and render access to the Internet.
Common user network. In 2004 Ukraine had 15 448 ATX, including 4 502 urban and 10 946 rural exchanges; gradually it is being replaced by more popular mobile communication. Ukraine operates cell phone networks, systems of paging, message trunking network, and personal satellite communication networks.
Cell phones are the leaders in commercial mobile communication in Ukraine. Top operators in Ukraine are UMC, Kyivstar GSM, Wellkom, DCC, and Golden Telecom. UMC, Kyivstar GSM, and DCC provide the best coverage. Kyivstar GSM covers 950 cities, in particular Oblast’ centers, and has 1 500 base communication stations.
Radio broadcasting, radio communication and television. Transmitters-receivers make radio communication possible. Radio communication equipment carries out broadcasting. The network of radio stations broadcast on long, medium, short, and ultra short waves. The total length of broadcasting network made 443 900 km in 2004, including 153 400 km of cable network. The most powerful radio stations are located in Kyiv, L’viv, and Mykolaiv.
The main components of telecasting are TV stations and relays, cables and satellites. The most powerful TV stations are located in Kyiv, Krasnohorivka (Poltava Oblast’), Vinnytsia, L’viv, Ternopil’, and Khmelnyts’kyi.
Science. Ukraine has great scientific potential. Despite the difficulties of economic transition, Ukraine managed to save its network of scientific establishments, which shows great viability of national science and its gradual adaptation to market conditions.
In 2005 there were 1 510 scientific and research organizations in Ukraine (55.4% of the total number are state, 33.2% – entrepreneurial, and 11.4 – other organizations). From 1991 till 2005 the amount of scientific organizations grew from 1 344 to 1 510 (12%).
58.6% of scientific organizations belong to some branch, 25.0% are academic institutions, 11.4% belong to higher educational establishments, and 5.0% – to plants or factories.
378 academic establishments, including the Institutes of the National Academy of Sciences and certain branch academies (agrarian, pedagogical, medical, engineering and law) are engaged in scientific research. Research work is carried out in 172 higher educational establishments as well.
Branch distribution of institutions is as follows: natural (30.6%) and technical sciences (53.0%). Ukraine has great scientific brainpower potential: there are 80 300 scholars of the highest qualification here; 12 ths of them have doctor’s degree.
In 2005 1.2% of GDP was allocated for R&D; the state budget allotted only 0.4%.
The bulk of technical projects were designed in Kyiv (33.5%) and Kharkiv (15.0%), Donets’k (9.1%), and Dnipropetrovs’k (7.5%) Oblast’s.
Scientists from Kyiv (29.5%), Donets’k (14.5%), Kharkiv (12.8%), Dnipropetrovs’k (6.9%) Oblast’s are the authors of many new technologies. The biggest number of innovative industrial enterprises is concentrated in Kyiv (34.9%), Kharkiv Oblast’s (11.0%), the AR of Crimea (6.6%), Chernihiv (6.5%), Ivano-Frankivs’k (9.5%), Ternopil’ (8.9%), and Kherson (8.7%) Oblast’s.
The main scientific potential is concentrated in the National Academy of Sciences of Ukraine, which is composed of 216 establishments. They are located in many cities and integrated in seven scientific centers: North-West, Donets’k, West, South, North-East, of the Dnipro River area, and Crimean.
There is a distinct correlation between the degree of territorial distribution of scientific and technical potential, the innovative activity and regional differences in economic potential of Oblast’s, levels of their socio-economic development, branch structure of production etc. The basic scientific centers carrying out priority researches are Kyiv, Kharkiv, Donets’k, Dnipropetrovs’k, L’viv, and Odesa.

